25 August 2022
From August 19 to 21, La Vuelta Holanda took place in the Netherlands. How clean is the air in the places that the peloton is visiting? Researchers from Utrecht University have mapped the annual average air quality of each stage of La Vuelta and demonstrate that the air is most polluted at the start (Utrecht) and finish (Madrid). They also conclude that for many stretches the air quality does not meet World Health Organization (WHO) guidelines. Nevertheless, the health benefits of cycling generally outweigh the risks.
It’s often said that "cycling is healthy" when we set off in all kinds of weather. But how clean is the air you breathe if you cycle the same route as the La Vuelta peloton on a normal day? This was the question researchers Roel Vermeulen and Jules Kerckhoffs asked themselves. Using satellite images, traffic information and air quality data about nitrogen dioxide, particulate matter and ozone, they made a stage map booklet showing the air quality for each stage of La Vuelta.
Much has been done in recent years to improve air quality, but we see that there are still many places where the air is not healthy"
The conclusion is clear: the most polluted stages are those in the Netherlands and from the Spanish La Rozas to Madrid. Particularly in the urban areas visited by the Vuelta, the air quality does not meet WHO guidelines, and sometimes not even the more flexible European Union guidelines. However, there are very few places where this European standard is exceeded and in many places air quality does nevertheless cause damage to health. In the Netherlands researchers estimate that approximately five thousand people die prematurely each year due to poor air quality. Worldwide, that is estimated to be around 7 million.
The stage maps created by Utrecht University researchers as part of the EXPANSE project, illustrate the average air pollution over the course of a year. Vermeulen and Kerckhoffs focus on the value recommended by the WHO for nitrogen dioxide in a year: ten micrograms per cubic meter. If you were to cycle the route to work or study every day, this is a critical value. If you cycle the route occasionally then the 24-hour guideline of 25 micrograms per cubic meter is more relevant. According to the WHO exceeding these guidelines results in damage to health. However, the EU limit value that is used in the Netherlands is a lot higher: 40 micrograms per cubic meter. This value is also reflected in the graphs accompanying the maps."
"Much has been done in recent years to improve air quality, but we see that there are still many places where the air is not healthy," said Vermeulen, who studies how environmental factors affect our health. "So improving air quality still requires attention." Vermeulen therefore calls on municipalities to look beyond the EU standard to which they must adhere, and to improve air quality according to WHO guidelines. For example, municipalities could encourage residents to travel by bike instead of by car for short distances and indirectly stimulate this behaviour when designing cities. "The so-called 15-minute cities, where facilities can be reached on foot or by bike within fifteen minutes, are a good example of this."
For the cyclists of the Vuelta, their trip will not directly result in damage to their health; after all, they ride each stage once only and not every day. Furthermore, there is no regular traffic on the road on the day of La Vuelta. This means that the air quality during the stage will be better, as was also previously demonstrated during the Grand Depart of the Tour de France.
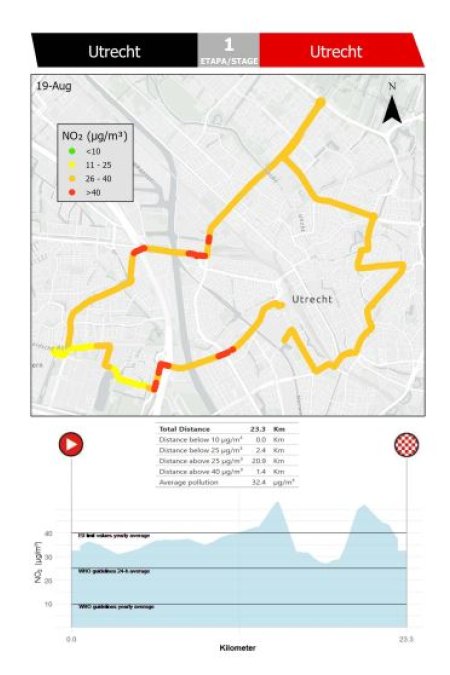
The research shows that the air quality of the first three stages in the Netherlands and of the final stage in and near Madrid, does not come close to the WHO advisory value for nitrogen dioxide (10 micrograms per cubic meter).
During the third stage (Breda-Breda), the concentration of nitrogen dioxide during a part of the ride (about 40 kilometers) is higher than the 24-hour WHO guidelines for nitrogen dioxide, and a small part is even higher than the EU limit. The average pollution of the total ride is 21 micrograms per cubic meter. The other stages in the Netherlands are also on average substantially more polluted than those in Spain, both for nitrogen dioxide and particulate matter. The prologue in Utrecht even has an average concentration of 32 micrograms per cubic meter. Because this stage is only 23.3 kilometers long, stages two (Den Bosch - Utrecht) and three (Breda-Breda) are worse for health. This is because you inhale more polluted air and therefore have a higher average over a 24 hours period.
If we look at the average concentration of nitrogen dioxide of the last stage (Las Rozas - Madrid), we see that it is even higher than the stages in the Netherlands. 35 kilometers of this stage exceed the EU limit of 40 micrograms of nitrogen dioxide per cubic meter. As in Utrecht, this is because a large part of the stage takes place in the inner city of Madrid.
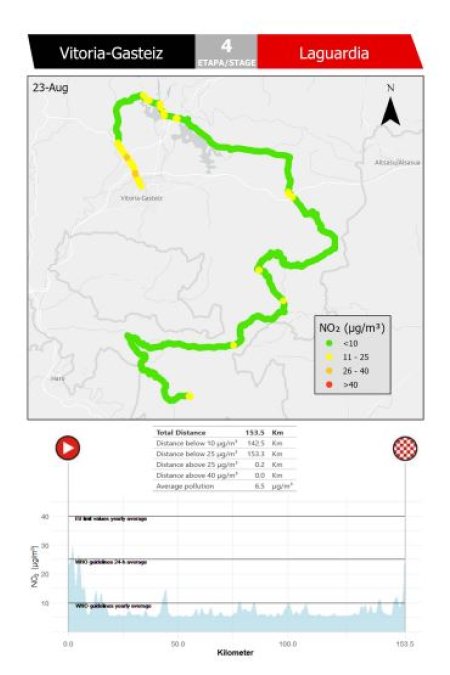
By comparing previous stages with that of Vitoria-Gasteiz to Laguardia in Spain, we can see how great the differences are. During stage 4 the concentration of nitrogen dioxide was below the WHO advisory value for almost the entire stage (142.5 km). The average during this ride is 6.5 micrograms per cubic meter. Interestingly however, the stage is not the cleanest for ozone. Ozone is formed from reactions of nitrogen oxides and volatile organic compounds in warm and sunny weather. Because the temperature is higher in Spain you can see that ozone concentrations are higher than those in the Netherlands.
This research shows that nitrogen dioxide concentrations above 25 micrograms per cubic meter (the daily limit according to the WHO) in urban areas are often unavoidable for cyclists. Does this mean you should have to take the bus to work from now on? "No," say Kerckhoffs and Vermeulen. "Even if you compare polluted air and other risks such as accidents to the health benefits of cycling, the risks are smaller than the benefits. Our evaluation is therefore not intended to discourage cycling. What we do want is to raise awareness about air quality in the Netherlands, and show that from a health perspective, there is still work to be done. Part of the solution can be found in the stimulation of active transport (cycling, walking) especially for short distances. We can stimulate this for example, by improving cycling infrastructure and by designing our urban living.

The environment we live in has a dominant impact on our health. It explains an estimated seventy percent of the chronic disease burden. Where we live, what we eat, how much we exercise, the air we breathe and whom we associate with; all of these environmental factors play a role. The combination of these factors over the life course is called the exposome. There is general (scientific) consensus that understanding more about the exposome will help explain the current burden of disease and that it provides entry points for prevention and ...
Read More